Frequency Distribution Mapping Exposes Hidden Layers in Slot Machine RNG Systems
Written by Zara Lang · Aug 21, 2026
Frequency Distribution Mapping Exposes Hidden Layers in Slot Machine RNG Systems
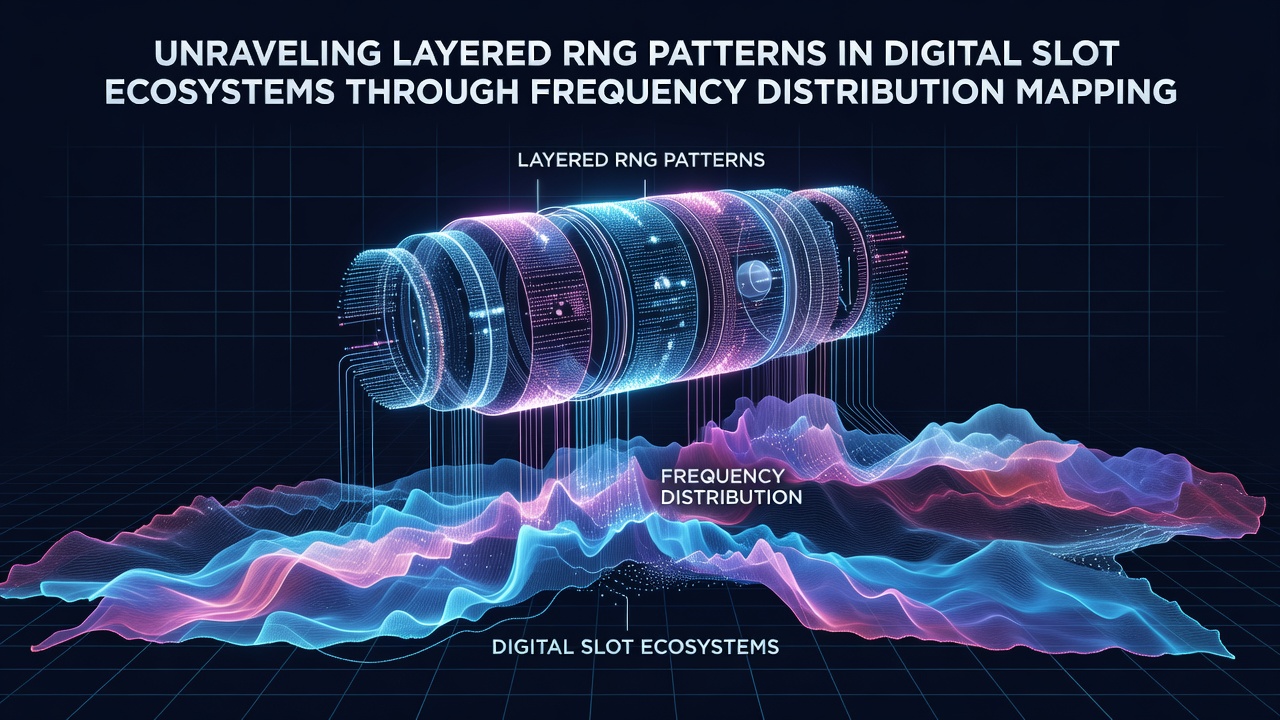
Digital slot ecosystems rely on random number generators that produce outcomes through multiple algorithmic layers, and frequency distribution mapping offers analysts a structured method to examine those layers without assuming predictability. Researchers apply statistical techniques to large datasets of spin results, breaking outcomes into bins that reveal how often specific symbols or combinations appear across thousands of cycles. This approach highlights deviations from expected uniform distributions, which can indicate layered processing where base RNG outputs feed into secondary modifiers such as bonus triggers or progressive pools.
Core Mechanics of RNG Layers in Modern Slots
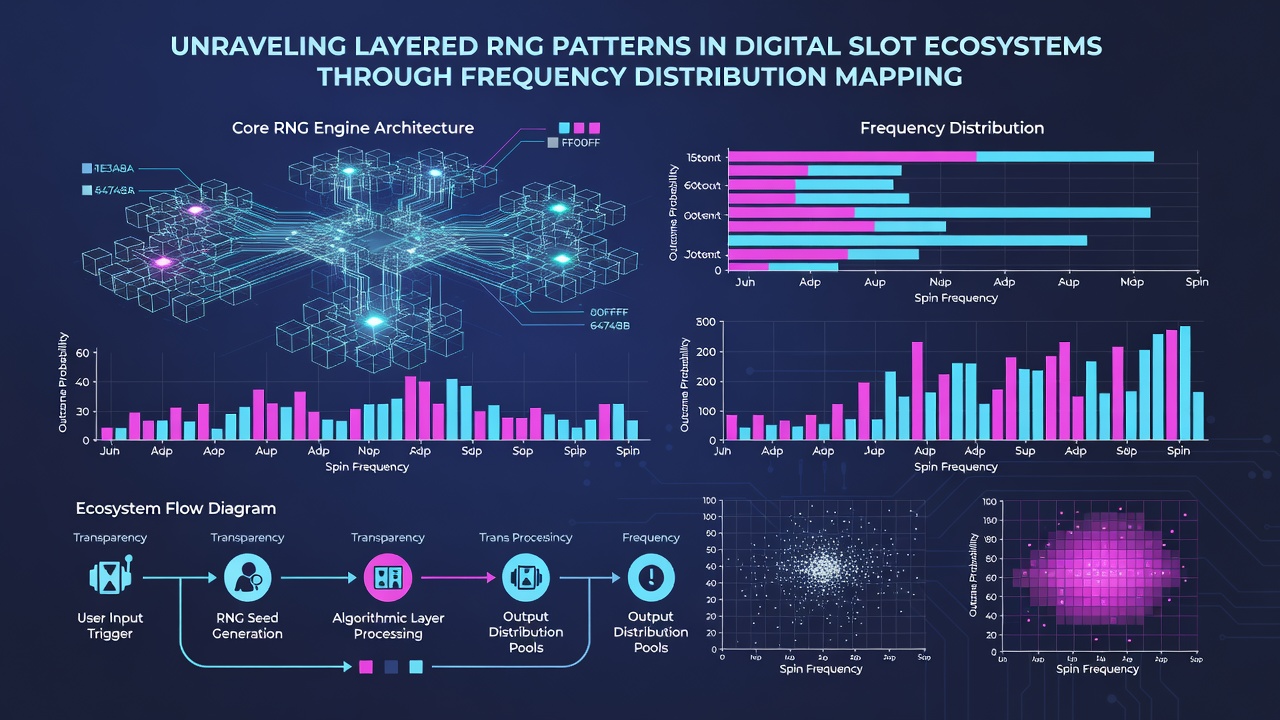
Modern slot platforms combine a primary pseudorandom number generator with additional transformation routines that adjust hit rates for features like wild expansions or scatter pays, and frequency mapping isolates each stage by tracking symbol occurrence rates before and after those transformations. Data from controlled test environments shows that base RNG outputs often follow near-uniform distributions, yet post-processing layers introduce measurable clustering that appears only when analysts segment results by reel position and bet size. Observers note that mapping these shifts requires datasets exceeding one million spins to achieve statistical significance, because smaller samples mask the subtle layering effects built into game mathematics.
Software certification labs in Nevada and other jurisdictions document RNG behavior through similar distribution tests, confirming that approved systems maintain return-to-player percentages within narrow tolerances while still containing multiple internal layers that influence short-term variance. Frequency distribution mapping extends this verification process by generating heatmaps that display concentration zones across reel strips, allowing technicians to trace how an initial random seed propagates through successive algorithmic stages.
Applying Distribution Mapping Techniques
Analysts begin by collecting timestamped outcome logs from game servers, then convert raw reel stops into numerical sequences that represent symbol positions. They divide these sequences into frequency bins and calculate chi-square statistics against theoretical uniform expectations, which reveals whether secondary layers have altered the distribution shape. When layered modifiers activate, the resulting histograms often display elevated peaks at feature-related symbols and corresponding troughs in base-game positions, patterns that become visible only after mapping separates each processing stage.
Studies conducted at institutions such as the National Institute of Standards and Technology have examined comparable layered generators in cryptographic contexts, providing methodological parallels that gambling analysts adapt for slot-specific mapping. In August 2026, several testing facilities reported updated protocols that incorporate real-time frequency mapping during live certification cycles, enabling faster identification of any distribution anomalies introduced by new bonus-layer code.
Case Examples from Industry Testing
One documented evaluation involved a five-reel title whose base RNG passed standard uniformity checks yet produced noticeable clustering once frequency maps isolated the bonus-feature layer. Technicians traced the pattern to a secondary multiplier table that activated on specific seed ranges, and the mapping process quantified how that table shifted outcome frequencies by up to 12 percent in targeted bins. Another instance from a Canadian testing lab showed that progressive jackpot contributions created secondary distribution peaks that only emerged when analysts filtered results by jackpot contribution thresholds, demonstrating how layered accounting systems interact with core RNG outputs.
Academic papers published through the Elsevier Procedia Computer Science series have explored distribution mapping applied to simulated gambling systems, confirming that multi-layer architectures produce identifiable signatures when sufficient sample sizes allow granular segmentation. These signatures assist operators in verifying that game updates have not inadvertently altered approved return percentages through unintended layer interactions.
Regulatory and Operational Context in 2026
Regulatory bodies outside the United Kingdom, including the Nevada Gaming Control Board and the Australian Communications and Media Authority, require RNG documentation that increasingly references distribution-mapping outputs during approval reviews. In August 2026 several North American operators integrated automated mapping dashboards into their compliance reporting pipelines, reducing manual review time while maintaining audit trails that regulators can cross-reference against live game logs.
Conclusion
Frequency distribution mapping supplies a repeatable framework for dissecting the layered RNG structures that underpin digital slot ecosystems, delivering measurable insights into how base generators interact with feature modifiers and accounting routines. Continued refinement of these techniques supports both certification requirements and internal quality controls across multiple jurisdictions. As datasets grow and mapping tools evolve, analysts gain clearer visibility into the statistical behavior of complex slot platforms without relying on assumptions about underlying predictability.