Mapping Momentum Decay in Live Tennis Betting Markets Through Point-by-Point Data Streams
Written by Zara Lang · Aug 18, 2026
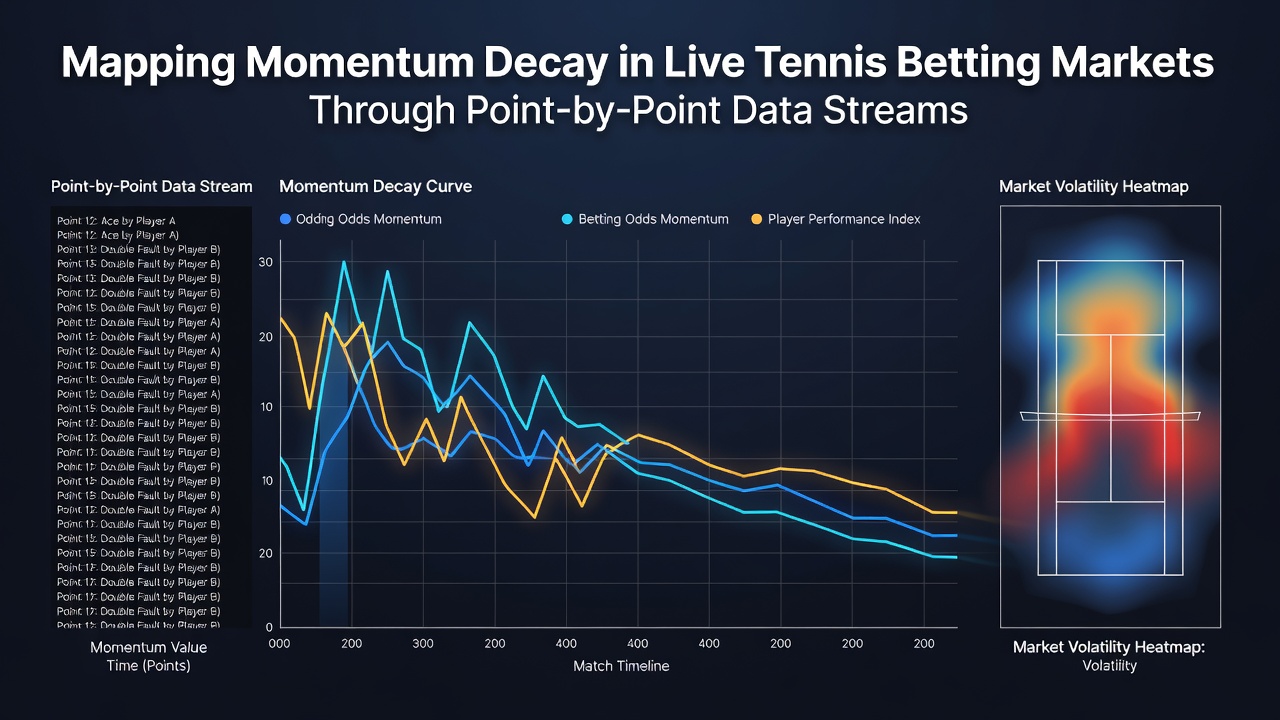
Mapping Momentum Decay in Live Tennis Betting Markets Through Point-by-Point Data Streams
Live tennis betting markets rely on continuous data feeds that update after every point, and these streams allow platforms to adjust odds in real time as momentum shifts occur during matches. Researchers tracking professional events have documented how betting prices respond to sequences of points rather than isolated outcomes, and this approach highlights patterns where initial advantages fade over successive rallies and games.
Data Streams and Market Adjustments
Point-by-point feeds from major tournaments supply raw inputs including serve outcomes, rally lengths, and error rates, which algorithms then convert into probability estimates for remaining sets and matches. Studies of ATP and WTA events show that markets incorporate these updates within seconds, yet the magnitude of price changes often diminishes after the first three to five points following a break or hold sequence. Observers note that this decay pattern appears consistently across hard courts, clay, and grass surfaces, although the rate varies with match length and player styles.
Analysts processing historical match files have identified clusters where a player's implied win probability spikes after consecutive points won but then reverts toward pre-point levels within two to four games. External data providers supply the granular timestamps required for such mapping, and betting exchanges reflect these reversions through tightening or widening spreads on next-game and set markets.
Measuring Decay Across Match Phases
Early set phases exhibit faster momentum erosion compared with later stages, because accumulated fatigue and score pressure alter how subsequent points influence overall expectations. Data collected from matches played in 2025 and early 2026 indicates that the half-life of a momentum impulse averages 2.8 points in opening sets yet extends to 4.1 points once a set reaches 5-5 or beyond. These figures come from aggregated feeds covering thousands of professional contests and remain stable when segmented by ranking tier.
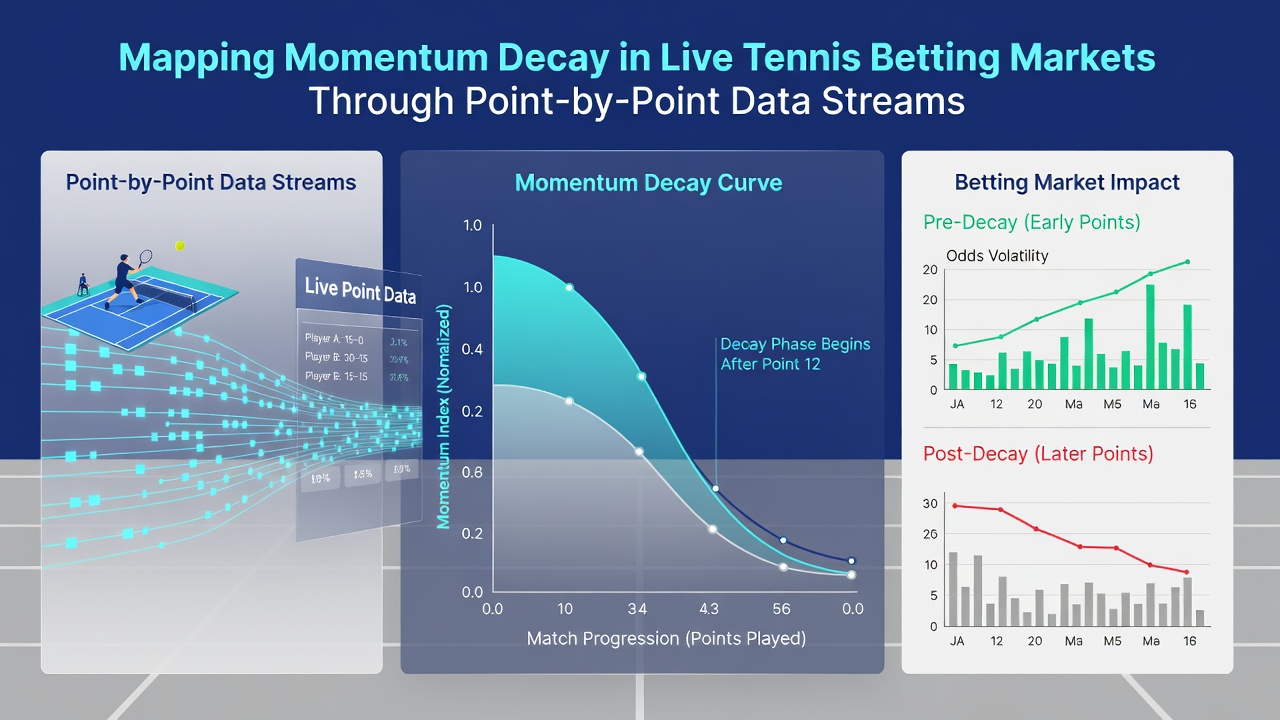
Models built on these observations assign decay coefficients to different event types, such as aces versus extended rallies, and operators apply the coefficients to recalibrate live odds. One analysis of grand-slam matches revealed that serve-hold streaks produce shorter-lived market impacts than return-game breaks, because hold sequences align more closely with baseline expectations held by market participants.
Practical Applications in Live Markets
Betting platforms integrate decay functions into their pricing engines so that odds on remaining games and sets reflect both the immediate point result and the expected reversion speed. Traders monitoring these markets can observe how a five-point advantage after a break shrinks by roughly 60 percent within the next two games when average rally data is applied. Such adjustments appear in both exchange and bookmaker interfaces, although the precise calibration differs by operator and liquidity level.
Academic work published through sports analytics journals has validated these decay rates against independent match logs, confirming that markets priced without decay components show larger deviations from closing prices. Regulators in jurisdictions including Australia and parts of Europe have begun reviewing how real-time data integrity affects fair pricing, and several federations now require timestamp verification for feeds used in wagering products.
Challenges in Implementation
Noise in point data, including delayed updates or incomplete rally statistics, can distort decay estimates and produce temporary mispricings. Teams maintaining these systems therefore apply filtering layers that discard anomalous sequences before they reach the pricing algorithm. Cross-validation against multiple data vendors reduces error rates, yet residual variance remains highest during rain delays or medical timeouts when point flow pauses.
Geographic variation in data latency also influences observed decay, with European and North American servers showing tighter alignment to actual court events than feeds routed through additional regional hops. Market makers account for these differences by widening spreads on lower-liquidity matches where data quality fluctuates.
Conclusion
Point-by-point data streams enable detailed mapping of momentum decay in live tennis markets, and the resulting models adjust probabilities according to observed reversion patterns across sets and surfaces. Continued refinement of these techniques depends on improved data quality and broader access to verified match logs from diverse tournaments worldwide.