Probability Dynamics in Baccarat Tie Bets Under Varying Shoe Penetration Conditions
Written by Blake Jenkins · Aug 16, 2026
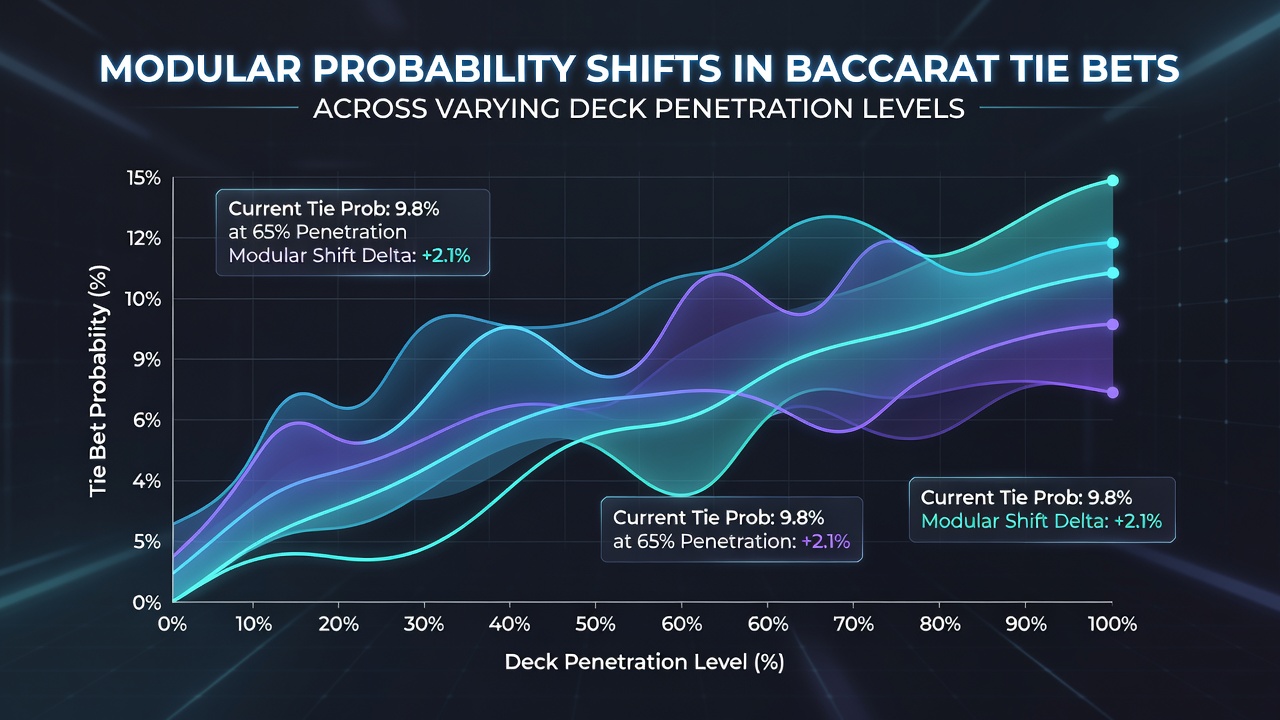
Probability Dynamics in Baccarat Tie Bets Under Varying Shoe Penetration Conditions
Multi-deck baccarat shoes create measurable changes in tie bet probabilities as cards are removed during play, and analysts track these variations through segmented penetration levels that divide the shoe into distinct modules. Each module corresponds to a percentage range of cards dealt, allowing observers to isolate how remaining card composition alters the likelihood of banker, player, and tie outcomes. Data collected from controlled simulations show that tie probabilities start near their theoretical baseline of approximately 9.52 percent at zero penetration and drift modestly as depletion progresses through the first 20 percent of the shoe.
Segmenting the Shoe Into Analytical Modules
Researchers divide an eight-deck shoe into ten equal modules, each representing roughly 10 percent penetration increments, so that probability calculations remain granular without excessive computational overhead. Within the initial module, tie frequency hovers close to the combinatorial expectation because few cards have left the deck and suit distributions stay balanced. Subsequent modules reveal small but consistent deviations once high-value cards and specific ranks begin to exit the shoe in uneven proportions. Studies conducted by the University of Nevada, Las Vegas Center for Gaming Research illustrate that tie rates can fluctuate between 9.35 percent and 9.72 percent across these modules when measured over millions of simulated hands.
Card removal effects compound because the tie outcome depends on both hands totaling exactly the same value, a condition sensitive to the depletion of tens and aces that influence tie resolutions more than other ranks. Observers note that modules three through five often display the steepest short-term swings, since cumulative depletion reaches a point where remaining cards no longer mirror the initial composition yet have not reached the final reshuffle trigger.
Data Patterns Across Penetration Thresholds
Statistical tracking reveals that tie bet returns exhibit a slight upward bias in modules six and seven when low cards have been removed disproportionately, increasing the chance that both hands land on matching totals between zero and nine. Conversely, modules eight through ten sometimes show a modest decline in tie frequency once the remaining deck becomes enriched with tens and face cards that push hand totals higher and reduce exact matches. These modular shifts remain small in absolute terms yet accumulate across thousands of decisions, prompting some operators to adjust table minimums or commission structures in response to observed patterns.
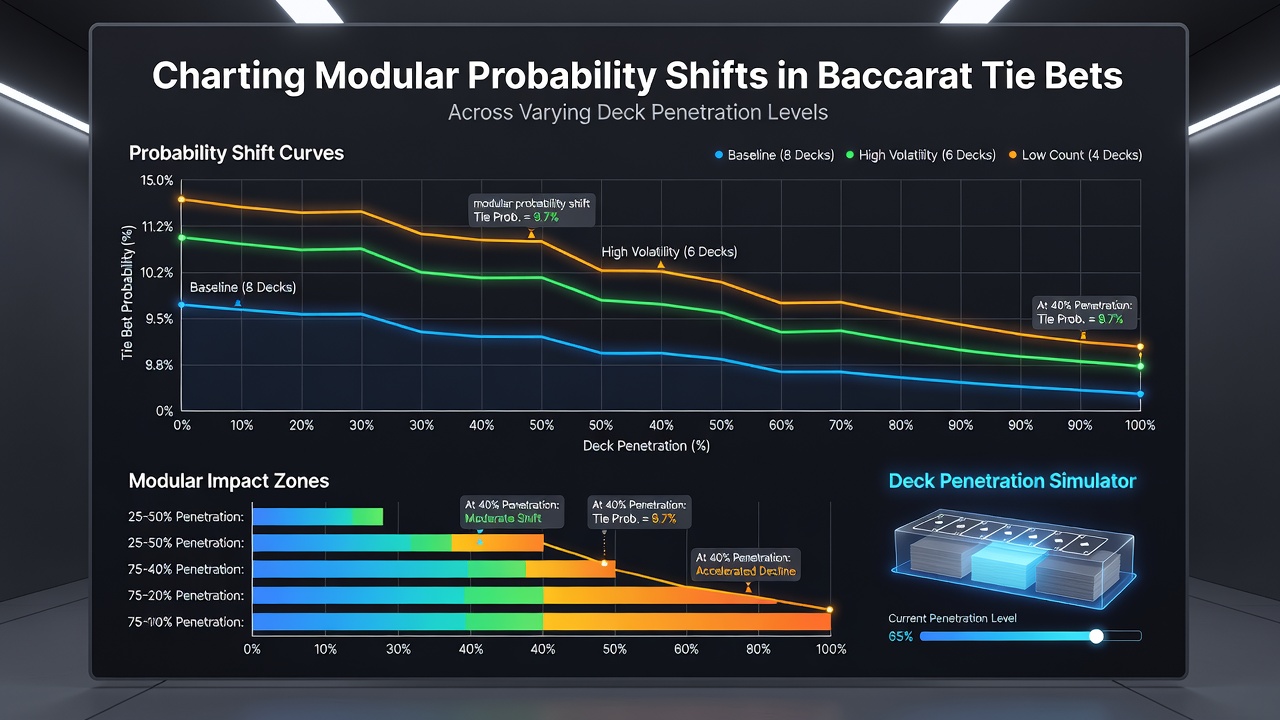
Industry reports from the Australian Gambling Research Centre indicate that live casino data collected between 2024 and 2026 align closely with simulation outputs once sample sizes exceed 500,000 hands per penetration band. The alignment holds because automated shoe tracking systems capture exact card sequences, enabling precise mapping of each module without human recording errors. Those who monitor these figures find that variance within individual sessions can exceed the modular drift, which explains why short-term results often mask the underlying probability curves.
Practical Implications for Tracking Systems
Casino surveillance teams and independent analysts employ modular spreadsheets that update tie probabilities after every 10 percent penetration milestone, feeding real-time alerts when observed frequencies deviate beyond two standard deviations from the module-specific baseline. Such systems rely on large historical datasets rather than predictive claims, and they function primarily as diagnostic tools that flag table conditions for further review. Because baccarat rules fix the drawing procedures, the probability adjustments stem solely from combinatorial depletion rather than strategic player decisions.
Penetration levels beyond 75 percent introduce additional considerations because some jurisdictions require reshuffles at fixed shoe depths, truncating the final modules and thereby limiting the observable range of probability movement. Data compiled by the Nevada Gaming Control Board show that tables operating under 80 percent penetration rules produce tighter modular distributions compared with venues allowing deeper play before reshuffle.
Conclusion
Modular charting of baccarat tie probabilities across deck penetration levels supplies a structured framework for documenting how card removal influences a single bet type within an otherwise rule-bound game. The resulting datasets remain useful for regulatory oversight, operational monitoring, and academic inquiry into finite-deck effects. Continued collection of granular hand histories will refine the precision of these curves as more venues adopt automated tracking technology.